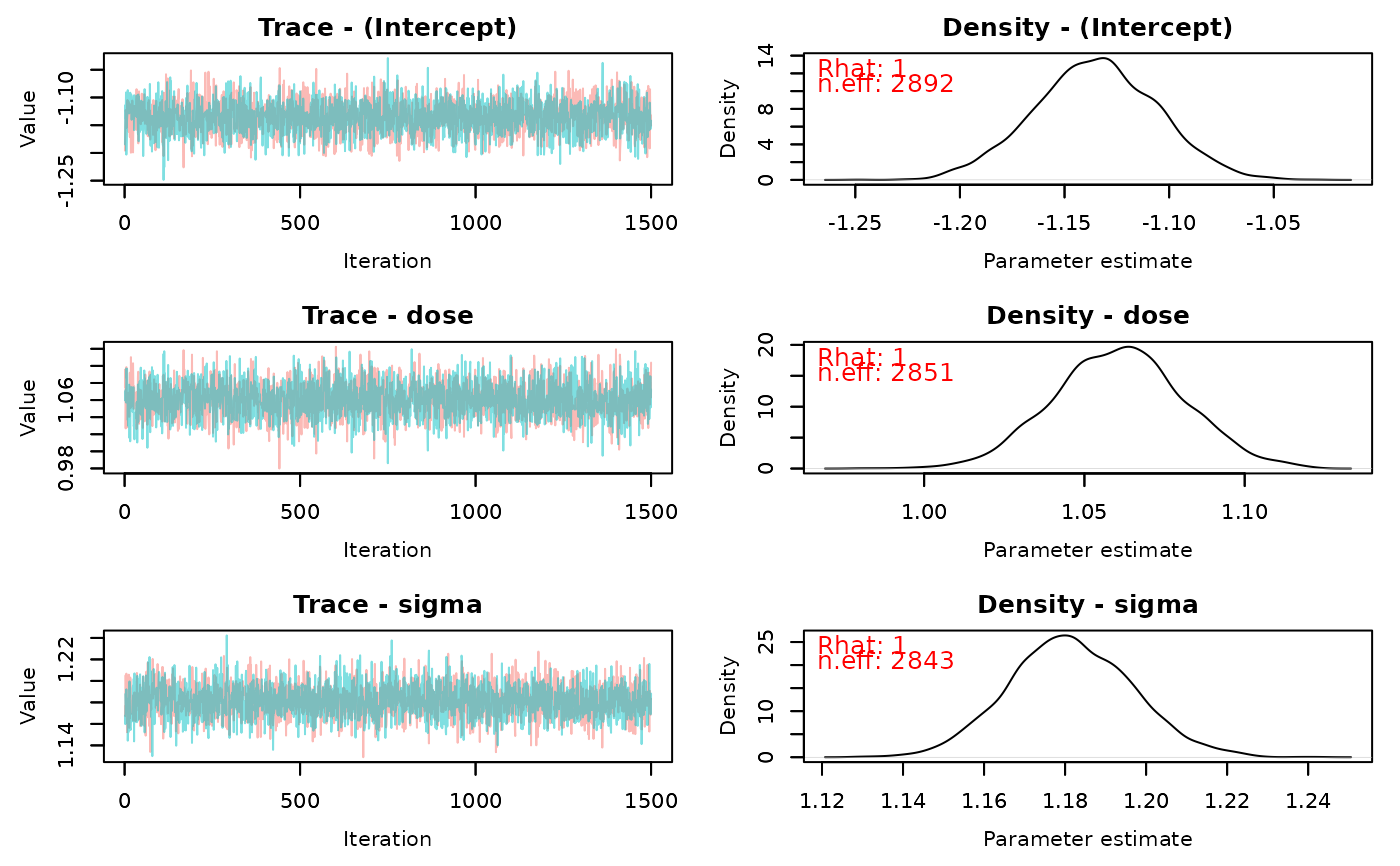
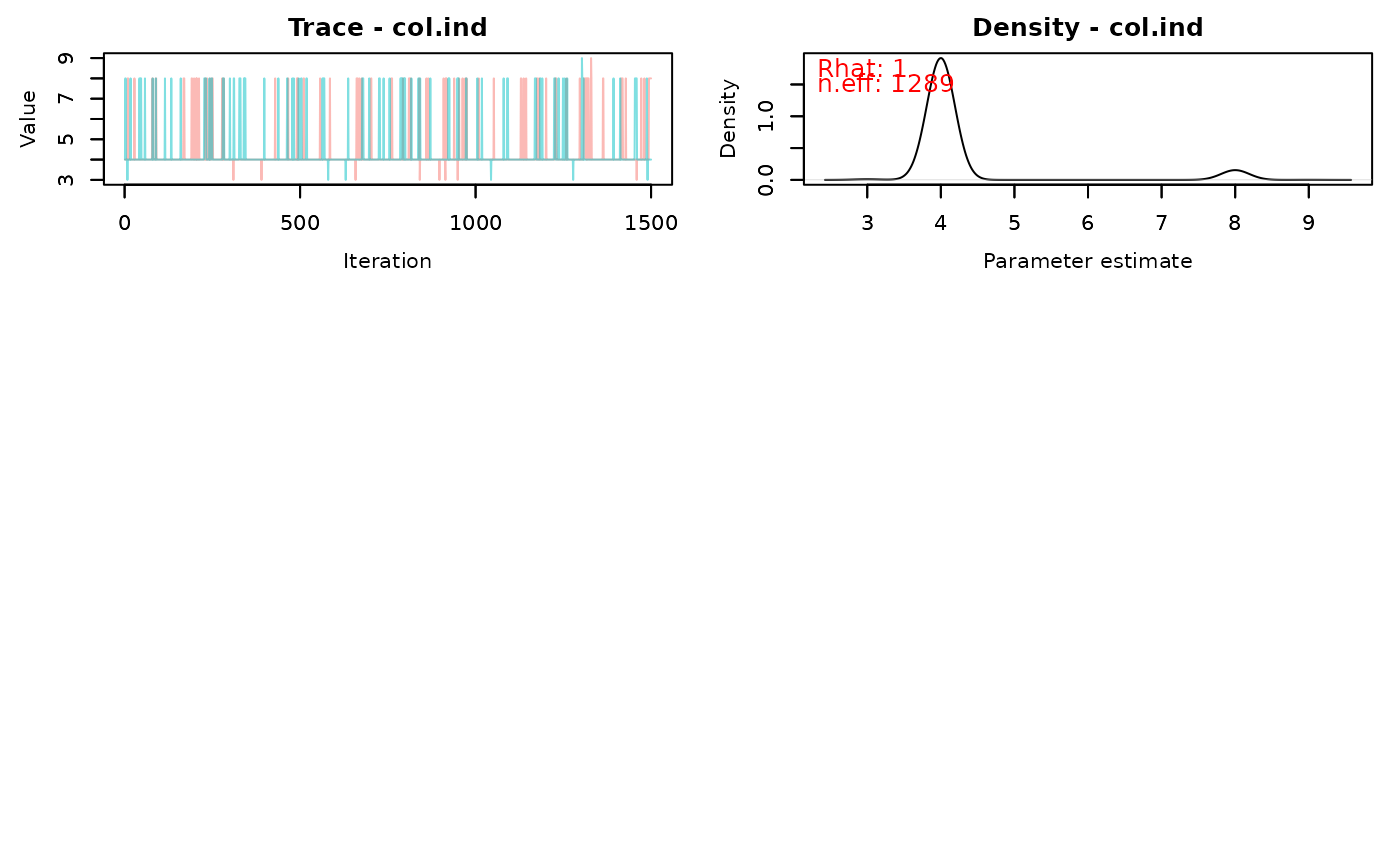
Traceplots for MCMC Samples
traceplot.RdProduce MCMC traceplots for amerasfit objects.
Usage
traceplot(object, ...)

# S3 method for class 'amerasfit'
traceplot(object, iter = 5000, Rhat = TRUE, n.eff = TRUE, pdf = FALSE, ...)
Arguments
- object
a
amerasfitobject containing BMA output to be plotted- iter
number of iterations to include in the traceplot (defaults to last 5000)
- Rhat
logical; whether to include R-hat diagnostics in the plot (default TRUE)
- n.eff
logical; whether to include effective sample size in the plot (default TRUE)
logical; whether to save the output as a PDF (default FALSE)
- ...
additional arguments passed to
MCMCtrace
Details
Wrapper for MCMCvis::MCMCtrace to produce MCMC diagnostic plots. See ?MCMCtrace for more plotting options that can be provided through ....
Examples
# \donttest{
   data(data, package="ameras")
   fit <- ameras(Y.gaussian~dose(V1:V10), data, methods="BMA")
#> Note: BMA may require extensive computation time
#> Fitting BMA
#> Defining model
#> Building model
#> Setting data and initial values
#> Running calculate on model
#>   [Note] Any error reports that follow may simply reflect missing values in model variables.
#> Checking model sizes and dimensions
#>   [Note] This model is not fully initialized. This is not an error.
#>          To see which variables are not initialized, use model$initializeInfo().
#>          For more information on model initialization, see help(modelInitialization).
#> Compiling
#>   [Note] This may take a minute.
#>   [Note] Use 'showCompilerOutput = TRUE' to see C++ compilation details.
#> Compiling
#>   [Note] This may take a minute.
#>   [Note] Use 'showCompilerOutput = TRUE' to see C++ compilation details.
#> running chain 1...
#> |-------------|-------------|-------------|-------------|
#> |-------------------------------------------------------|
#> running chain 2...
#> |-------------|-------------|-------------|-------------|
#> |-------------------------------------------------------|
   traceplot(fit)


# }
# }